Um alle Funktionen dieser Seite zu nutzen, aktivieren Sie bitte die Cookies in Ihrem Browser.
Meine Merkliste
my.chemie.de
my.chemie.de
Mit einem my.chemie.de-Account haben Sie immer alles im Überblick - und können sich Ihre eigene Website und Ihren individuellen Newsletter konfigurieren.
- Meine Merkliste
- Meine gespeicherte Suche
- Meine gespeicherten Themen
- Meine Newsletter
24 Infografiken zum Thema Periodensystem
rss| Sie können Ihre Recherche weiter verfeinern. Wählen Sie aus dem linken Bereich passende Suchfilter aus, um Ihre Ergebnisse gezielt einzugrenzen. |
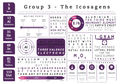
Group 3 Elements
Element Infographics
The latest in the series of infographics on groups in the periodic table, this one looks at some general information on Group 3. I’m aware that, technically (according to IUPAC) it should be referred to as Group 13.
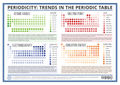
Periodicity
Trends in the Periodic Table
This graphic looks at several properties of elements in the Periodic Table. These properties show trends, also referred to as ‘periodicity’, as you progress along a period. The emphasis of this graphic is on giving a general impression of each of the trends; although a rough scale is given to the ...
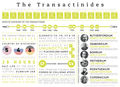
The Transactinides
Element Infographics
The final elements infographic looks at the Transactinides. These elements are all synthetically produced, and do not occur naturally; as such their applications are minimal, and their chemistry relatively unknown. Hence this graphic looks more at their general properties, and at some of the ...
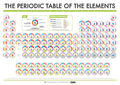
The Compound Interest Periodic Table of Data
Today’s graphic is one that I’ve been working on over the past couple of weeks. Every chemistry classroom has a Periodic Table, but it’s often a drab affair; considering it’s one of the cornerstones of chemistry, I thought I’d attempt to produce a more dynamic looking version. The result is the ...
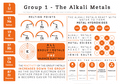
Group 1 Elements
Element Infographics
I wanted to display all the key points about each group of elements, in a way that was both clear and engaging for the pupils – as a consequence, the information presented is relatively basic, so that it’s accessible for as many of the year groups as possible. I also tried to include some ...
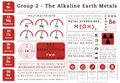
Group 2 Elements
Element Infographics
The second of a series of infographics on the groups of the periodic table, here some general properties of the group 2 elements are examined. As stated previously, these are primarily aimed at secondary school students, hence the relative simplicity and generality of the information presented.
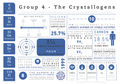
Group 4 Elements
Element Infographics
This latest infographic focuses on the Group 4 elements. One extra fact to add for the curious: although tin has the greatest number of stable isotopes, Xenon trumps it comprehensively if unstable isotopes are also included in the count, with well over 30 possible isotopes.
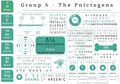
Group 5 Elements
Element Infographics
The latest of the element infographics looks at the Group 5 elements. There is, once again, an interesting fact that I couldn’t quite fit in, or left out at the expense of others:Bismuth-209 was long thought to have heaviest stable nucleus of any element, until 2003 when it was determined by ...
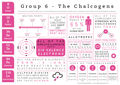
Group 6 Elements
Element Infographics
This latest graphic looks at the elements of Group 6. ‘Chalcogens’ is an IUPAC accepted name for Group 6. The term chalcogen itself comes from the greek word ‘chalcos‘, and roughly translates as ‘ore-former’.
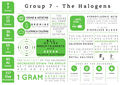
Group 7 Elements
Element Infographics
This graphic looks at the halogens, found in Group 7 of the Periodic Table. This group consists of the elements fluorine, chlorine, bromine, iodine and astatine – the as yet provisionally named artificial element 117, tennessine, may also be a halogen. As always, the following are a few ...
Sie erhalten passend zu Ihrer Suche die neusten Suchergebnisse per E-Mail. Dieser Service ist für Sie kostenlos und kann jederzeit abbestellt werden.